Stop flying blind with your ESB infrastructure. Get real-time visibility into Aurea Messenger (formerly Progress Sonic ESB, CX Messenger, SonicMQ) with enterprise-grade monitoring that integrates seamlessly with your existing DevOps stack.
“ESB is a black box for us and we hope it just works.”
— former IT Manager
Why Aurea Messenger Monitoring Matters
Do you really know what your ESB or messaging infrastructure is doing? Most integration teams struggle with:
- Hidden bottlenecks that impact business operations
- Queue buildups discovered only after customer complaints
- Memory leaks in messaging containers going undetected
- Performance degradation with no early warning system
- Infrastructure costs that could be optimized
Monitor Progress Sonic ESB / CX Messenger / SonicMQ with Modern Tools
Our monitoring package transforms Aurea Messenger into a fully observable component of your integration architecture, supporting all major monitoring platforms.
Traffic-Light View of Connected Systems
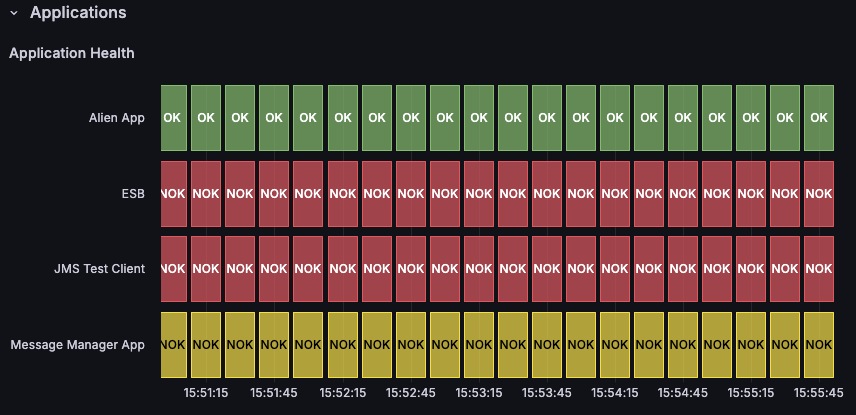
Get instant visibility into your integration layer. Spot application issues immediately. Even flow control situations are detected and visualized.
Supported Monitoring Platforms
Grafana + Prometheus Integration
- Native Prometheus metrics export
- Pre-built Grafana dashboards for queue monitoring
- Custom alerting rules for threshold breaches
- Time-series analysis of message throughput
Elastic Stack (Elasticsearch + Kibana)
- Real-time log aggregation from Aurea Messenger
- Kibana dashboards for operational insights
- Advanced search capabilities across message flows
- Integration with existing ELK stack deployments
Splunk Enterprise
- Structured event forwarding to Splunk
- Custom Splunk apps for ESB monitoring
- Correlation with other enterprise systems
- Advanced analytics and reporting
Additional Platform Support: contact us
Real-Time ESB Metrics & Alerting
Core Monitoring Capabilities
Queue Performance Monitoring
- Queue fill levels in percentage
- Message throughput rates (messages/second)
- Average message processing time
- Dead letter queue accumulation alerts
System Resource Monitoring
- Container heap usage levels in percentage
- CPU utilization per messaging broker
- Memory allocation and garbage collection metrics
- Network I/O statistics for message routing
Application-Level Insights
- Per user/system/application metrics
- Durable subscription monitoring and health
- Connection pool utilization
- Transaction rollback rates
Example Operations Dashboard

How to Monitor Aurea Messenger with Grafana
Step 1: Metrics Exposure Our monitoring agent exposes metrics and notifications from Aurea Messenger services and brokers in Prometheus format, enabling native Grafana integration without performance impact.
Step 2: Dashboard Configuration
Pre-configured Grafana dashboards provide immediate visibility into:
- Message queue depths and processing rates
- Broker health and resource utilization
- End-to-end message flow visualization
- Alert correlation across your integration landscape
Step 3: Alerting Setup Configure intelligent alerts that trigger on:
- Queue depth thresholds (configurable per queue)
- Processing time anomalies
- Memory usage patterns indicating potential leaks
- Connection failures and retry patterns
Progress Sonic ESB Queue Monitoring Best Practices
Queue Depth Management
Monitor queue fill levels as percentages rather than absolute counts. This approach scales across different environments and provides consistent alerting thresholds.
Durable Subscription Health
Track the health of durable subscriptions to prevent message accumulation that can impact broker performance and storage utilization.
Flow Control Recognition
Detect flow control situations before they impact business operations. Our monitoring recognizes when producers are throttled and provides visibility into the root causes.
Aurea Messenger Performance Monitoring Features
Metrics & Notifications Extraction
- Non-intrusive monitoring that doesn’t affect message processing performance
- Comprehensive metric coverage including broker, queue, and connection statistics
- notificationse including flow control notifications
- Real-time data export with configurable collection intervals
- Historical trending for capacity planning and performance analysis
Container Memory Monitoring
- Heap usage tracking
- Memory leak detection insights
ESB Cloud Monitoring Package Features
✅ Expose Metrics and Notifications to Dashboards
✅ Works with Standard and Enterprise Edition
✅ Independent of Event Monitor or Elastic Offloading
✅ Various Monitoring Platforms Supported (Grafana/Prometheus, Splunk, Elastic/Kibana)
✅ Additional Metrics: Per User/System/Application, Durable Subscriptions, Queue Fill %, Container Heap %
Ready to Get Visibility into Your Aurea Messenger Infrastructure?
Stop guessing about your ESB performance. Get the monitoring visibility your integration architecture deserves.
Contact us to discuss how our Aurea Messenger monitoring package can integrate with your existing DevOps monitoring stack and provide the operational insights you need.